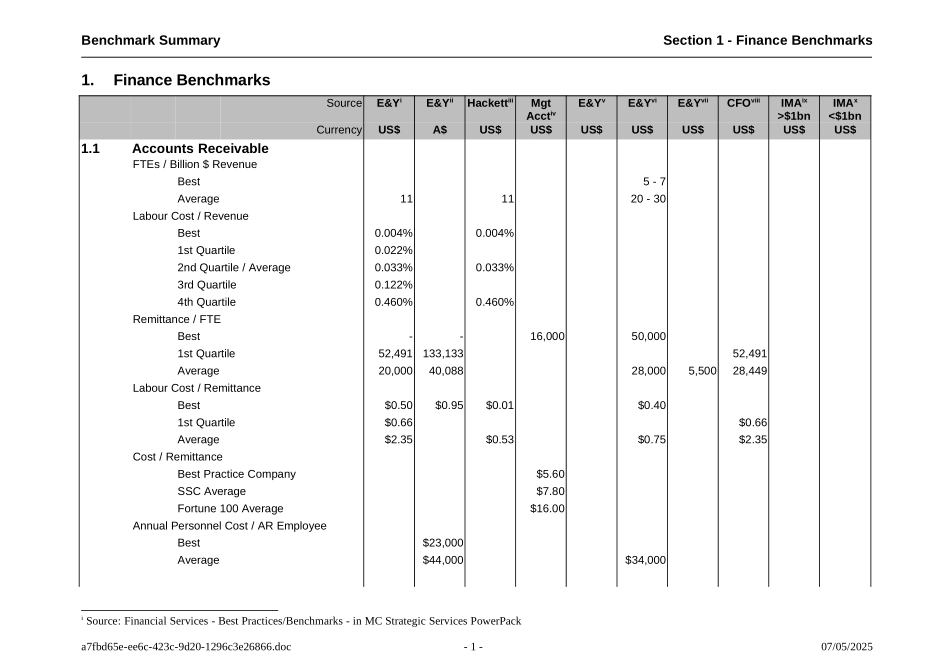
ConsolidatedBenchmarkingDataQuantitativeDataforFinance,HR&CallCentreServicesLastUpdated:26February1998PreparedBy:PhilWigglesworthBenchmarkSummaryContentsTableofContents1.FINANCEBENCHMARKS............................................................................................................................................................................................................................11.1.ACCOUNTSRECEIVABLE.................................................................................................................................................................................................................11.2.CREDIT&COLLECTIONS.................................................................................................................................................................................................................21.3.BILLING&INQUIRY.......................................................................................................................................................................................................................32.IMAFINANCEBENCHMARKS...................................................................................................................................................................................................................52.1.HEADCOUNTPERBILLION$REVENUE............................................................................................................................................................................................52.2.LABOURCOSTASAPERCENTAGEOFSALES....................................................................................................................................................................................62.3.SYSTEMCOSTASAPERCENTAGEOFSALES....................................................................................................................................................................................72.4.OTHERCOSTASAPERCENTAGEOFSALES......................................................................................................................................................................................82.5.TotalCostasaPercentageofSales...........................................................................................................................................................................................................9a7fbd65e-ee6c-423c-9d20-1296c3e26866.doc207/05/2025BenchmarkSummarySection1-FinanceBenchmarks1.FinanceBenchmarksSourceE&YiE&YiiHackettiiiMgtAcctivE&YvE&YviE&YviiCFOviiiIMAix>$1bnIMAx<$1bnCurrencyUS$A$US$US$US$US$US$US$US$US$1.1AccountsReceivableFTEs/Billion$RevenueBest5-7Average111120-30LabourCost/RevenueBest0.004%0.004%1stQuartile0.022%2ndQuartile/Average0.033%0.033%3rdQuartile0.122%4thQuartile0.460%0.460%Remittance/FTEBest--16,00050,0001stQuartile52,491133,13352,491Average20,00040,08828,0005,50028,449LabourCost/RemittanceBest$0.50$0.95$0.01$0.401stQuartile$0.66$0.66Average$2.35$0.53$0.75$2.35Cost/RemittanceBestPracticeCompany$5.60SSCAverage$7.80Fortune100Average$16.00AnnualPersonnelCost/AREmployeeBest$23,000Average$44,000$34,000iSource:FinancialServices-BestPractices/Benchmarks-inMCStrategicServicesPowerPacka7fbd65e-ee6c-423c-9d20-1296c3e26866.doc-1-07/05/2025BenchmarkSum...