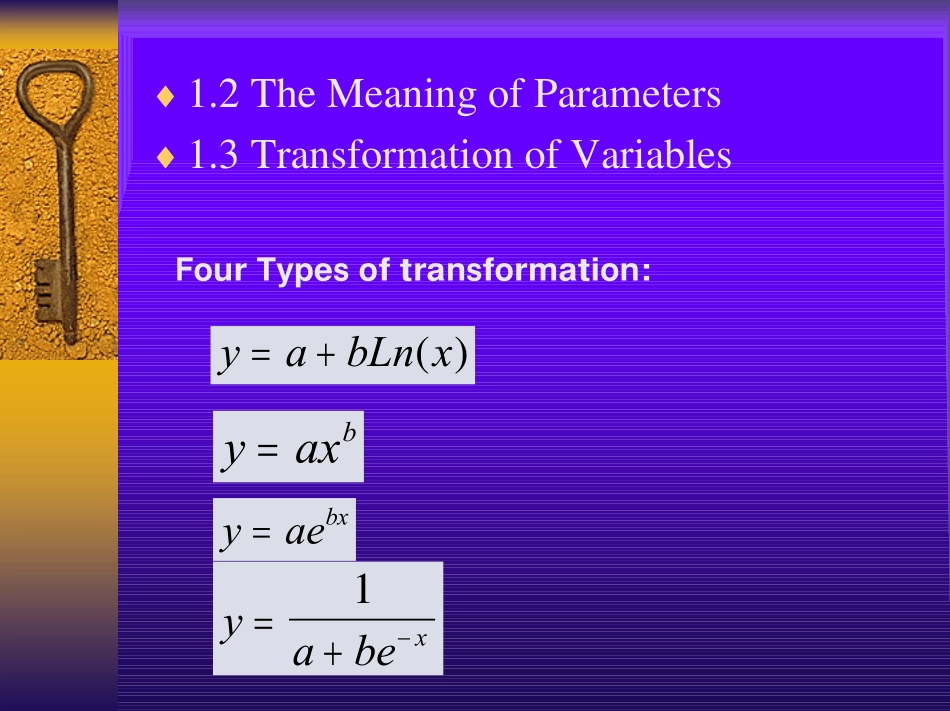
LinearRegressionTwoRoles:1.Interpretation2.Forecast1.SingleLinearRegression1.1TheEquationofSingleLinearRegressionY=A+BX+єŷ=a+bx♦1.2TheMeaningofParameters♦1.3TransformationofVariablesFourTypesoftransformation:yabLnx=+()yaxb=yaebx=yabex=+−11.4FeaturesofOLSWhatisOLS(OrdinaryLeastSquares)?()[]()($)eyyyabxiiii∑∑∑=−=−+222()()()aybxbxxyyxxiii=−=−−−∑∑,2无偏、一致和有效♦1.♦2.♦3.♦4.ei∑=0()ei∑21nyyi$∑=()()Covxenxxeii(,)=−=∑10♦5.♦6.Centerpoint()()Covyenyyeii($,)$=−=∑10(,)yx1.5HypothesisofModel1.StandardClassicalHypotheses(abouterror)(a)零均值性(b)等方差性(c)误差项之间相互独立(即不相关)性(d)误差项与自变量之间相互独立性Theabovehypothesesareforthegenerallinearregressionmodelonly.EXiNii(/);,,...,ε==012DXVarXiNiiii(/)(/);,,...,εεδ===212CovijijNij(,);,,,,...,εε=≠=012CovX(,)ε=02.HypothesesofNormalDistributionofError♦NormalDistribution:XYiii,,εNoroNorY(,);($,)δδ22ε的来源:方程中未包括的其他因素的影响以及Y的随机误差。ε的正态分布:根据中心极限定理,如果ε代表多种来源的误差之和,则不论那些误差各自分布如何,随着样本量的增加,其和ε将渐近于正态分布。1.6examinationoflinearhypothesis♦1.WhetheritisNormalDistributionHistogram;NormalProbabilityPlot♦2.Whetherthereisalinerrelationship♦3.均方差性的检验♦4.特异值Scatterplotof*zresidand*pred♦5.单个自变量偏误差图检查1.正态分布检验:标准化误差直方图RegressionStandardizedResidual2.001.501.00.500.00-.50-1.00-1.50-2.00HistogramDependentVariable:FOODEXPFrequency1086420Std.Dev=.98Mean=0.00N=30.00标准化误差为横坐标,其频数为纵坐标(income)Data:Reg_case1.sav正态分布检验:标准化误差正态概率散点图NormalP-PPlotofRegressionStandardizedReDependentVariable:FOODEXPObservedCumProb1.00.75.50.250.00ExpectedCumProb1.00.75.50.250.00Data:Reg_case1.sav累计误差的观察值与正态分布条件下的期望值比较(income)2.因变量与自变量之间是否为线性ScatterplotDependentVariable:FOODEXPRegressionStandardizedResidual3210-1-2RegressionStandardizedPredictedValue43210-1-2散点图中无明显趋势,说明基本符合线形假设(income)Data:Reg_case1.sav3.均方差性检验ScatterplotDependentVariable:FOODEXPRegressionStandardizedResidual3210-1-2RegressionStandardizedPredictedValue43210-1-2Data:Reg_case1.sav横轴各点上散点的终向分布宽度基本相等(income)4.是否存在特异值ScatterplotDependentVariable:FOODEXPRegressionStandardizedPredictedValue43210-1-2RegressionStandardizedResidual3210-1-2如果存在超过+或-2的标准化误差值,可以认为是特异值。(income)Data:Reg_case1.sav5.单个自变量偏误差散点图检查PartialRegressionPlotDependentVariable:FOODEXPINCOME8006004002000-200-400-600-800FOODEXP4003002001000-100-200-300在控制了PRICE之后,INCOME与食品支出仍然呈线性关系。Data:Reg_case1.sav5.单个自变量偏误差散点图检查PartialRegressionPlotDependentVariable:FOODEXPPRICE.8.6.4.20.0-.2-.4FOODEXP2001000-100-200在控制了INCOME之后,PRICE与食品支出基本无关。Data:Reg_case1.sav6.是否存在误差序列相关衡量误差项之间是否存在序列相关的指标______________________________________024dLdU4−dU4−dL经验:2左右的值表明不存在误差序列相关7.检查多重共线形容限度(接受水平>=0.1)tolerenceRRiiik=−=−112212....VIF(方差膨胀因子):为容限度的倒数Data:Reg_case1.sav2.MultipleLinearRegression�2.1TheEquationofMultipleLinearRegression�2.2MeaningofCoefficientsYBBXBXBXkk=+++++01122...εybbxbxbxeiiikiki=+++++01122...$...ybbxbxbxkk=++++011223.方程的解释能力♦R-squareTSS=RSS+ESSR-square表明不同模型的fitness;♦AdjustedR-square去除样本数与变...