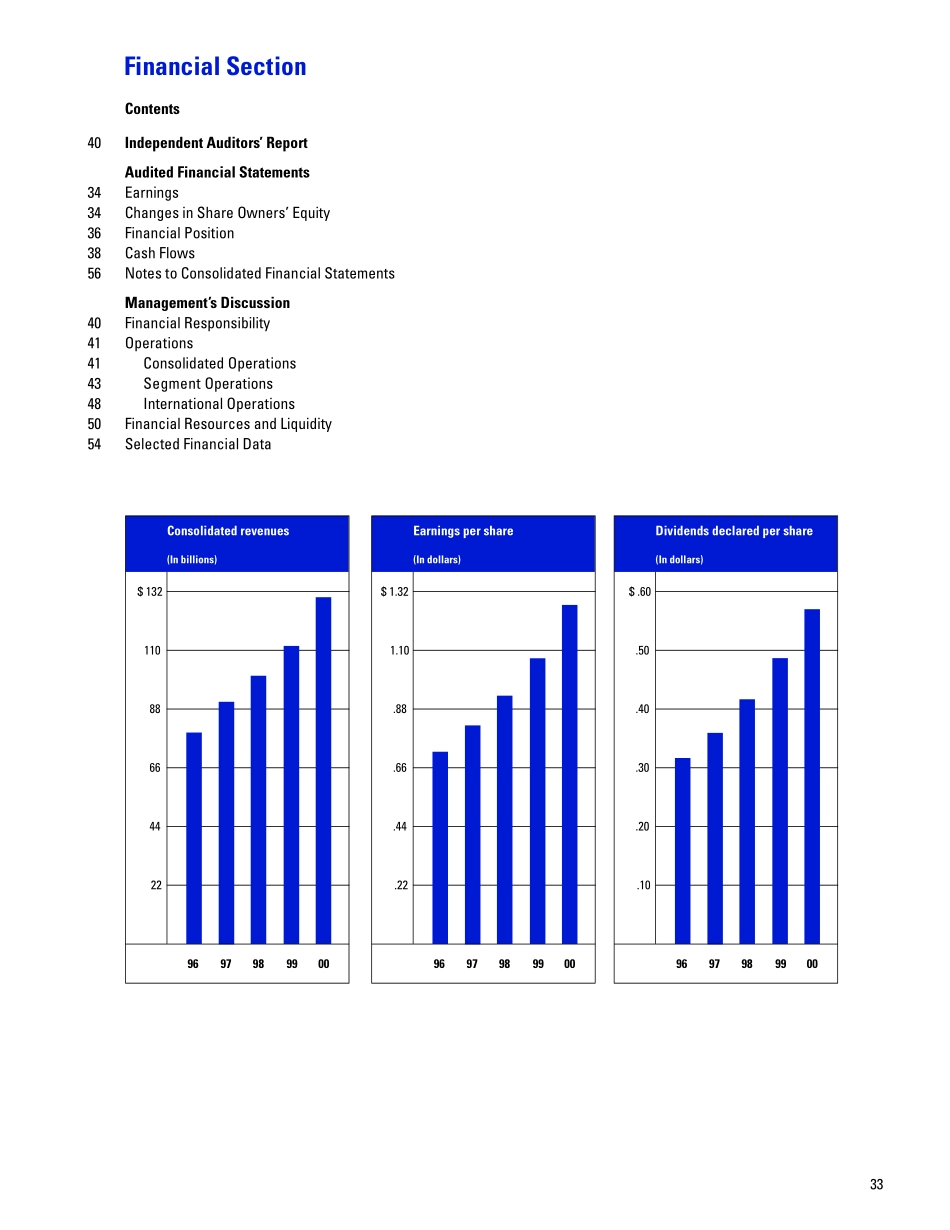
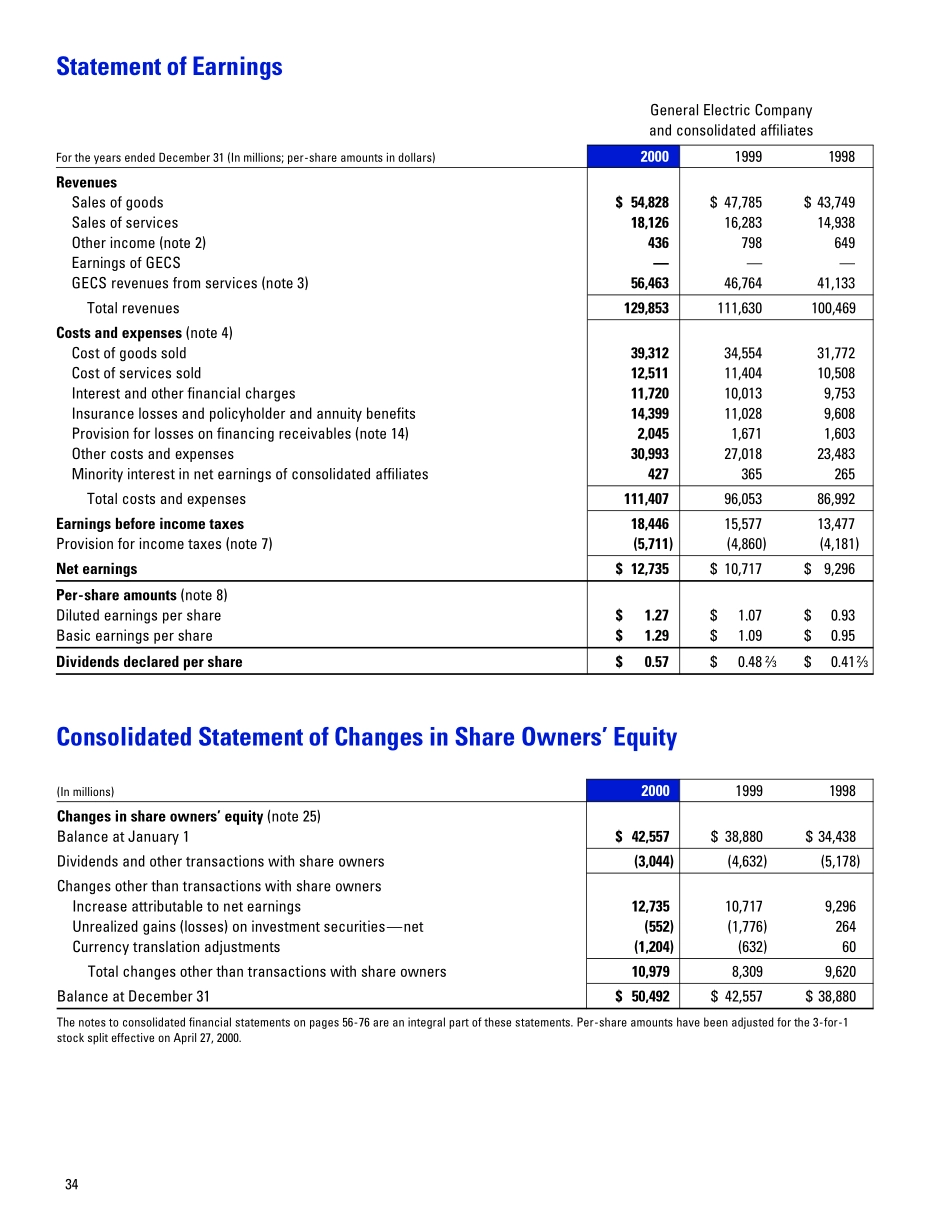
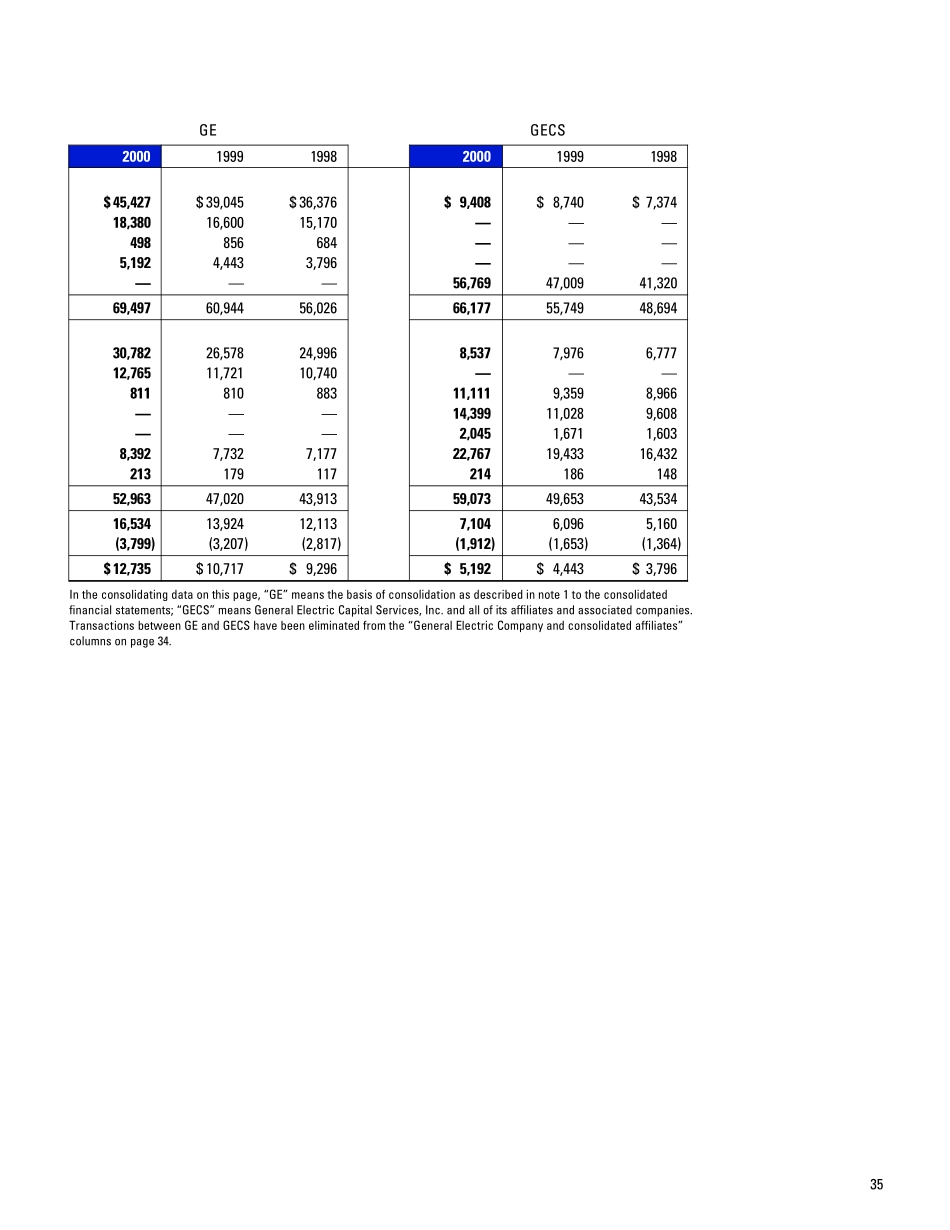
33FinancialSectionContents40IndependentAuditors’ReportAuditedFinancialStatements34Earnings34ChangesinShareOwners’Equity36FinancialPosition38CashFlows56NotestoConsolidatedFinancialStatementsManagement’sDiscussion40FinancialResponsibility41Operations41ConsolidatedOperations43SegmentOperations48InternationalOperations50FinancialResourcesandLiquidity54SelectedFinancialDataDividendsdeclaredpershare(Indollars).10.20.30.40.50$.600099989796Earningspershare(Indollars).22.44.66.881.10$1.320099989796Consolidatedrevenues(Inbillions)22446688110$132009998979634GeneralElectricCompanyandconsolidatedaffiliatesFortheyearsendedDecember31(Inmillions;per-shareamountsindollars)200019991998RevenuesSalesofgoods$54,828$47,785$43,749Salesofservices18,12616,28314,938Otherincome(note2)436798649EarningsofGECS———GECSrevenuesfromservices(note3)56,46346,76441,133Totalrevenues129,853111,630100,469Costsandexpenses(note4)Costofgoodssold39,31234,55431,772Costofservicessold12,51111,40410,508Interestandotherfinancialcharges11,72010,0139,753Insurancelossesandpolicyholderandannuitybenefits14,39911,0289,608Provisionforlossesonfinancingreceivables(note14)2,0451,6711,603Othercostsandexpenses30,99327,01823,483Minorityinterestinnetearningsofconsolidatedaffiliates427365265Totalcostsandexpenses111,40796,05386,992Earningsbeforeincometaxes18,44615,57713,477Provisionforincometaxes(note7)(5,711)(4,860)(4,181)Netearnings$12,735$10,717$9,296Per-shareamounts(note8)Dilutedearningspershare$1.27$1.07$0.93Basicearningspershare$1.29$1.09$0.95Dividendsdeclaredpershare$0.57$0.48°$0.41°StatementofEarnings(Inmillions)200019991998Changesinshareowners’equity(note25)BalanceatJanuary1$42,557$38,880$34,438Dividendsandothertransactionswithshareowners(3,044)(4,632)(5,178)ChangesotherthantransactionswithshareownersIncreaseattributabletonetearnings12,73510,7179,296Unrealizedgains(losses)oninvestmentsecurities—net(552)(1,776)264Currencytranslationadjustments(1,204)(632)60Totalchangesotherthantransactionswithshareowners10,9798,3099,620BalanceatDecember31$50,492$42,557$38,880Thenotestoconsolidatedfinancialstatementsonpages56-76areanintegralpartofthesestatements.Per-shareamountshavebeenadjustedforthe3-for-1stockspliteffectiveonApril27,2000.ConsolidatedStatementofChangesinShareOwners’Equity35GEGECS200019991998200019991998$45,427$39,045$36,376$9,408$8,740$7,37418,38016,60015,170———498856684———5,1924,4433,796——————56,76947,00941,32069,49760,94456,02666,17755,74948,69430,78226,57824,9968,5377,9766,77712,76511,72110,740———81181088311,1119,3598,966———14,39911,0289,608———2,0451,6711,6038,3927,7327,17722,76719,43316,43221317911721418614852,96347,02043,91359,07349,65343,53416,53413,92412,1137,1046,0965,160(3,799)(3,207)(2,817)(1,912)(1,653)(1,364)$12,735$10,717$9,296$5,192$4,443$3,796Intheconsolidatingdataonthispage,“GE”meansthebasisofconsolidationasdescribedinnote1totheconsolidatedfinancialstatements;“GECS”meansGeneralElectricCapitalServices,Inc.andallofitsaffiliatesandassociatedcompanies.TransactionsbetweenGEandGECShavebeeneliminatedfromthe“GeneralElectricCompanyandconsolidatedaffiliates”columnsonpage34.36GeneralElectricCompanyandconsolidatedaffiliatesAtDecember31(Inmillions)20001999AssetsCashandequivalents$8,195$8,554Investmentsecurities(note10)91,33981,758Currentreceivables(note11)9,5028,531Inventories(note12)7,...