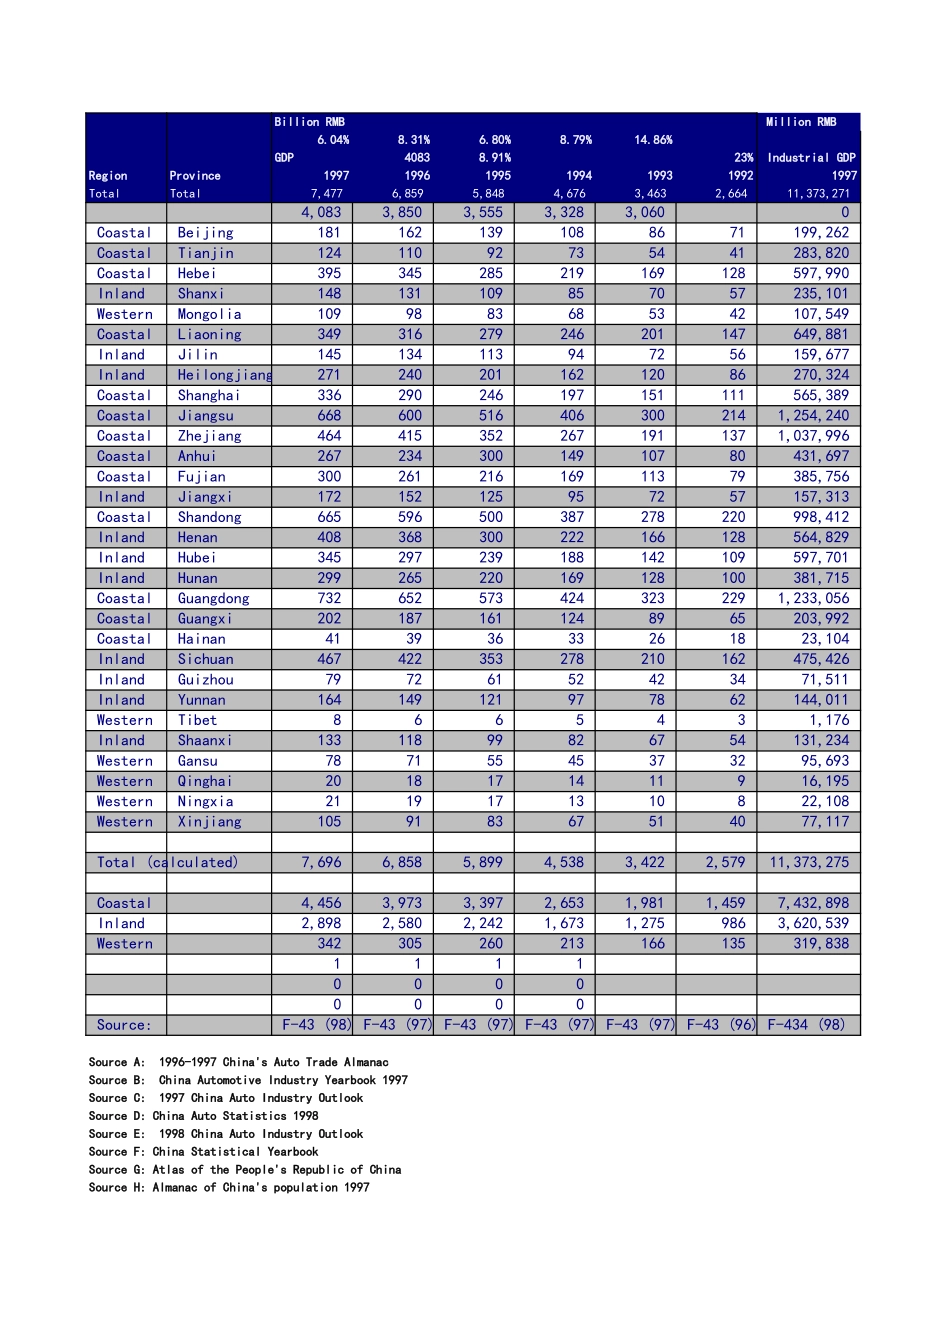
FAWWesternMarketpotentialP.331999AllTruckWestVol=150230=FAWWestVol.=11870FAWWesternratio=7.9%2010DCmodeltotalwesternvolumeforecast=203562本工作表包含所有与一汽“销售效率增进”相关的数据、假设与分析。ThisworkbookcontainsallFAWprojectrelateddata.DataInputAnalysisandCalculationChartsOutputBillionRMBMillionRMB6.04%8.31%6.80%8.79%14.86%GDP40838.91%23%IndustrialGDPRegionProvince1997199619951994199319921997TotalTotal7,4776,8595,8484,6763,4632,66411,373,2714,0833,8503,5553,3283,0600CoastalBeijing1811621391088671199,262CoastalTianjin12411092735441283,820CoastalHebei395345285219169128597,990InlandShanxi148131109857057235,101WesternMongolia1099883685342107,549CoastalLiaoning349316279246201147649,881InlandJilin145134113947256159,677InlandHeilongjiang27124020116212086270,324CoastalShanghai336290246197151111565,389CoastalJiangsu6686005164063002141,254,240CoastalZhejiang4644153522671911371,037,996CoastalAnhui26723430014910780431,697CoastalFujian30026121616911379385,756InlandJiangxi172152125957257157,313CoastalShandong665596500387278220998,412InlandHenan408368300222166128564,829InlandHubei345297239188142109597,701InlandHunan299265220169128100381,715CoastalGuangdong7326525734243232291,233,056CoastalGuangxi2021871611248965203,992CoastalHainan41393633261823,104InlandSichuan467422353278210162475,426InlandGuizhou79726152423471,511InlandYunnan164149121977862144,011WesternTibet8665431,176InlandShaanxi13311899826754131,234WesternGansu78715545373295,693WesternQinghai2018171411916,195WesternNingxia2119171310822,108WesternXinjiang105918367514077,117Total(calculated)7,6966,8585,8994,5383,4222,57911,373,275Coastal4,4563,9733,3972,6531,9811,4597,432,898Inland2,8982,5802,2421,6731,2759863,620,539Western342305260213166135319,838111100000000Source:F-43(98)F-43(97)F-43(97)F-43(97)F-43(97)F-43(96)F-434(98)SourceA:1996-1997China'sAutoTradeAlmanacSourceB:ChinaAutomotiveIndustryYearbook1997SourceC:1997ChinaAutoIndustryOutlookSourceD:ChinaAutoStatistics1998SourceE:1998ChinaAutoIndustryOutlookSourceF:ChinaStatisticalYearbookSourceG:AtlasofthePeople'sRepublicofChinaSourceH:AlmanacofChina'spopulation1997RMBIndustrialGDPUrbanresidentpercapitanetincome199619951994199319921997199619959,959,5309,829,3707,690,9405,552,5003,706,5705,1894,8454,288---6,67510,373185,300190,860204,330151,360108,5807,8627,3396,238238,600209,400183,810140,48099,7906,6215,9764,931514,500399,570370,200262,400173,3604,9824,4463,923205,500175,360143,740109,53074,4104,0083,7063,30793,870718,17064,00052,00036,1703,9683,4462,874560,200497,490459,870351,080233,7904,5474,2103,707153,800142,900128,090103,33076,7804,2063,8063,176237,400220,380181,430139,430110,3104,1103,7693,377506,700512,900425,520332,790242,9308,4768,1917,1961,155,6001,181,280982,610709,650467,3605,8075,1884,647882,100808,780582,810397,240249,8207,3666,9606,225361,800315,590225,230155,82099,5804,6204,5153,797321,100280,070247,820154,78091,5506,2015,1764,511133,600129,140156,79093,64064,6204,0913,7823,381912,700845,630822,000597,010355,3705,2174,8934,265527,500471,510343,680244,440162,8604,1123,7573,302483,600410,260302,470198,320137,3704,6944,3674,032328,100245,150192,540143,890100,6805,2495,0604,7051,053,100953,540720,420523,740347,9408,6168,1667,445173,400166,610138,07090,59058,2805,1405,0454,80921,59019,33016,48012,8107,5704,9184,9684,803416,900442,640404,050282,890184,9804,9354...