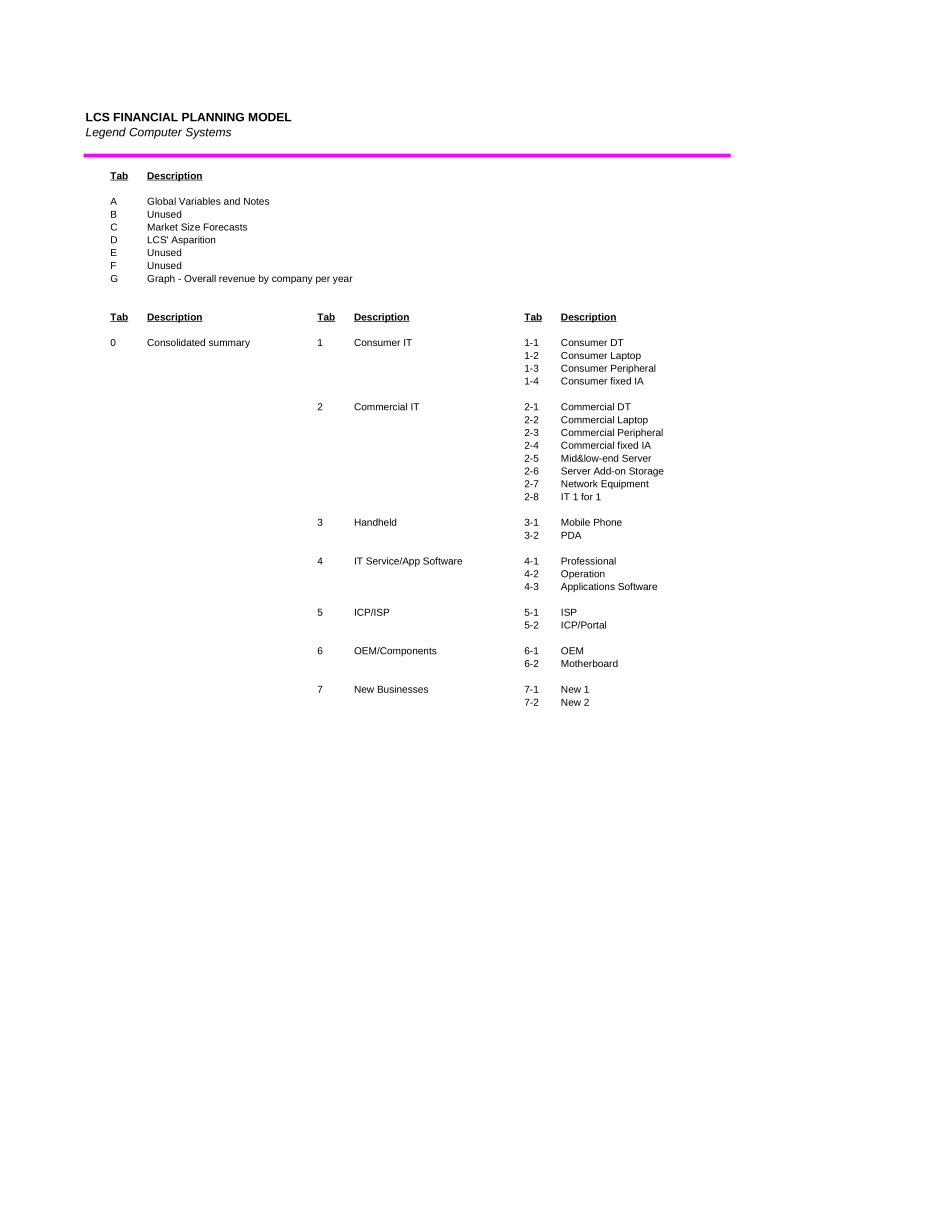
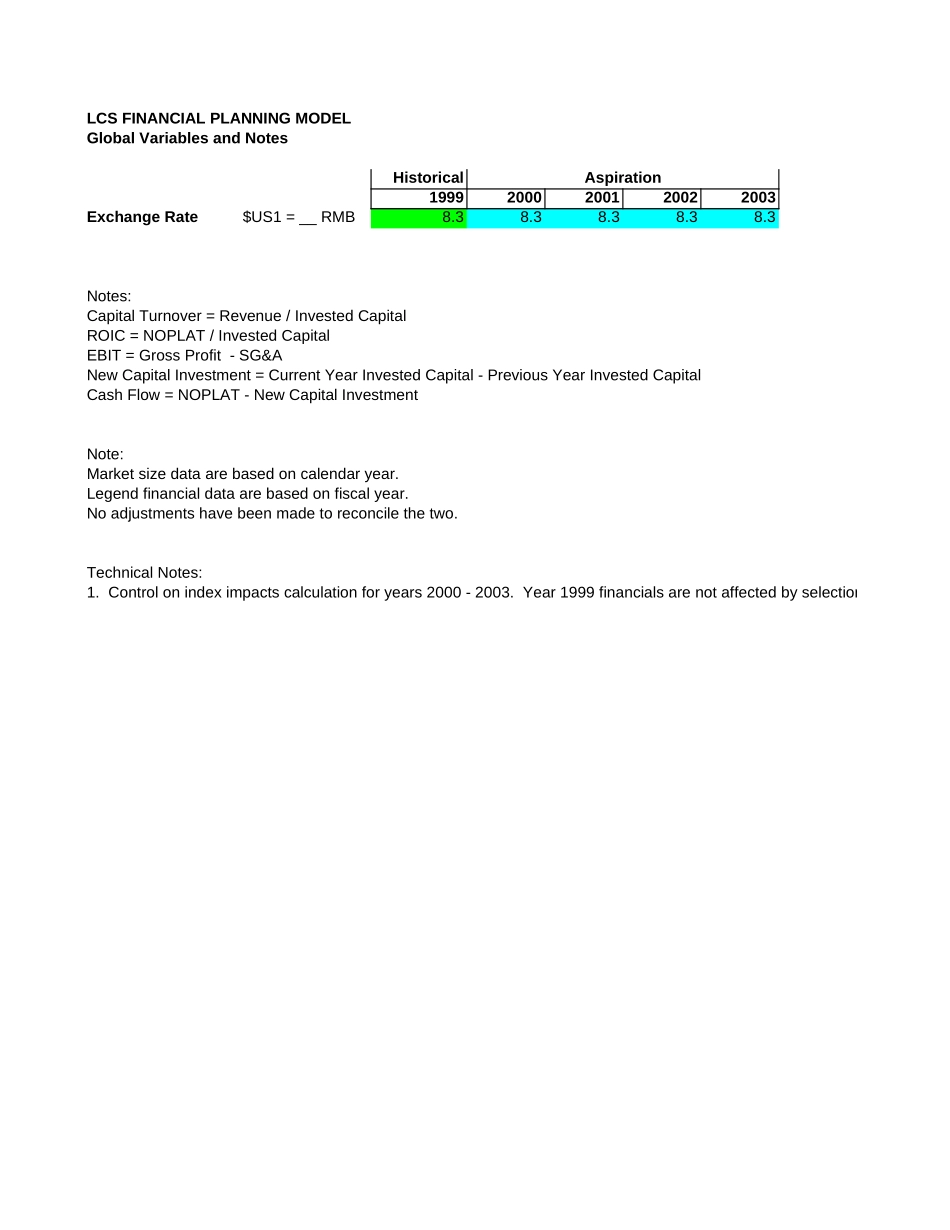
LCSFINANCIALPLANNINGMODEL1.Index2.ConsolidatedfinancialforecastSheet0,1,2,3,…3.FinanicalforecastofindividualindustrysegementsSheet1-1,1-2,1-3,…4.HistoricalinformationandmarketassumptionsSheetA,B,C,…5.DemonstrationchartsLCSFINANCIALPLANNINGMODELLegendComputerSystemsTabDescriptionAGlobalVariablesandNotesBUnusedCMarketSizeForecastsDLCS'AsparitionEUnusedFUnusedGGraph-OverallrevenuebycompanyperyearTabDescriptionTabDescriptionTabDescription0Consolidatedsummary1ConsumerIT1-1ConsumerDT1-2ConsumerLaptop1-3ConsumerPeripheral1-4ConsumerfixedIA2CommercialIT2-1CommercialDT2-2CommercialLaptop2-3CommercialPeripheral2-4CommercialfixedIA2-5Mid&low-endServer2-6ServerAdd-onStorage2-7NetworkEquipment2-8IT1for13Handheld3-1MobilePhone3-2PDA4ITService/AppSoftware4-1Professional4-2Operation4-3ApplicationsSoftware5ICP/ISP5-1ISP5-2ICP/Portal6OEM/Components6-1OEM6-2Motherboard7NewBusinesses7-1New17-2New2LCSFINANCIALPLANNINGMODELGlobalVariablesandNotesHistoricalAspiration19992000200120022003ExchangeRate$US1=__RMB8.38.38.38.38.3Notes:CapitalTurnover=Revenue/InvestedCapitalROIC=NOPLAT/InvestedCapitalEBIT=GrossProfit-SG&ANewCapitalInvestment=CurrentYearInvestedCapital-PreviousYearInvestedCapitalCashFlow=NOPLAT-NewCapitalInvestmentNote:Marketsizedataarebasedoncalendaryear.Legendfinancialdataarebasedonfiscalyear.Noadjustmentshavebeenmadetoreconcilethetwo.TechnicalNotes:1.Controlonindeximpactscalculationforyears2000-2003.Year1999financialsarenotaffectedbyselectionofbusinesses.1.Controlonindeximpactscalculationforyears2000-2003.Year1999financialsarenotaffectedbyselectionofbusinesses.MARKETSIZEDATABASEThissheetislinkedtomasterLCSMarketSizeDatabase.Donoteditmarketsizeestimateshere.Makeeditsonmasterfileonly.CodeCodeSector/IndustryChinaMarketSize-US$MillionsWorldwideMarketSize-US$MillionsSource19992000200120022003CAGR1999-200319992000200120022003CAGR1999-200311-0PersonalComputer11-1ConsumerDT1343230331514311589944.8%37228395854020340990429063.6%IDC,McKAnalysis11-2CommercialDT3421402343814858544112.3%885889351696429995141035214.0%IDC,McKAnalysis11-3Laptop734109815331926247335.5%47552512275724962671679699.3%IDC11-4STB12211114514522069262.4%McKAnalysis22-0InternetAccessDevices22-1MobilePhone5422610573278094893113.3%33700McKAnalysis22-2PDA21736151573488942.3%McKAnalysis33-0SystemsandNetworking33-1Middle&low-end1003126815841891220921.8%56645606876582770887761277.7%IDC33-1APCServer425553746934114328.1%162232071024865274643034816.9%33-1BOtherLow-MidrangeServer578715838957106616.6%40422399774096243423457793.2%33-2Mainframe&High-end8385941001066.5%1115910763104811034010457-1.6%IDC33-3ServerAdd-onStorage21630142957266232.3%23248250652677028799313127.7%33-4Network1491213428343585415129.2%50019548886124565528693938.5%IDC,July200044-0Peripherals44-1PrintCapable2214266528613087335010.9%McKAnalysis44-2DisplayDevice2577327440675068625824.8%McKAnalysis44-3MultimediaInput177208331538100054.1%5273McKAnalysis44-4OtherAdd-Ons1195143517712227283724.1%McKAnalysis55-0Components#VALUE!55-1Semiconductor16920022210028180032150030410015.8%16920022210028180032150030410015.8%55-2ModularComponents2216034446510346886182695221603444651034688618269539.0%55-2AMotherboard750086259919114071311815.0%750086259919114071311815.0%Globaldata,McKAnalysis55-2BModularexceptmotherboard146602582141115574546957847.6%1466025821411155745469578Globaldata,M...