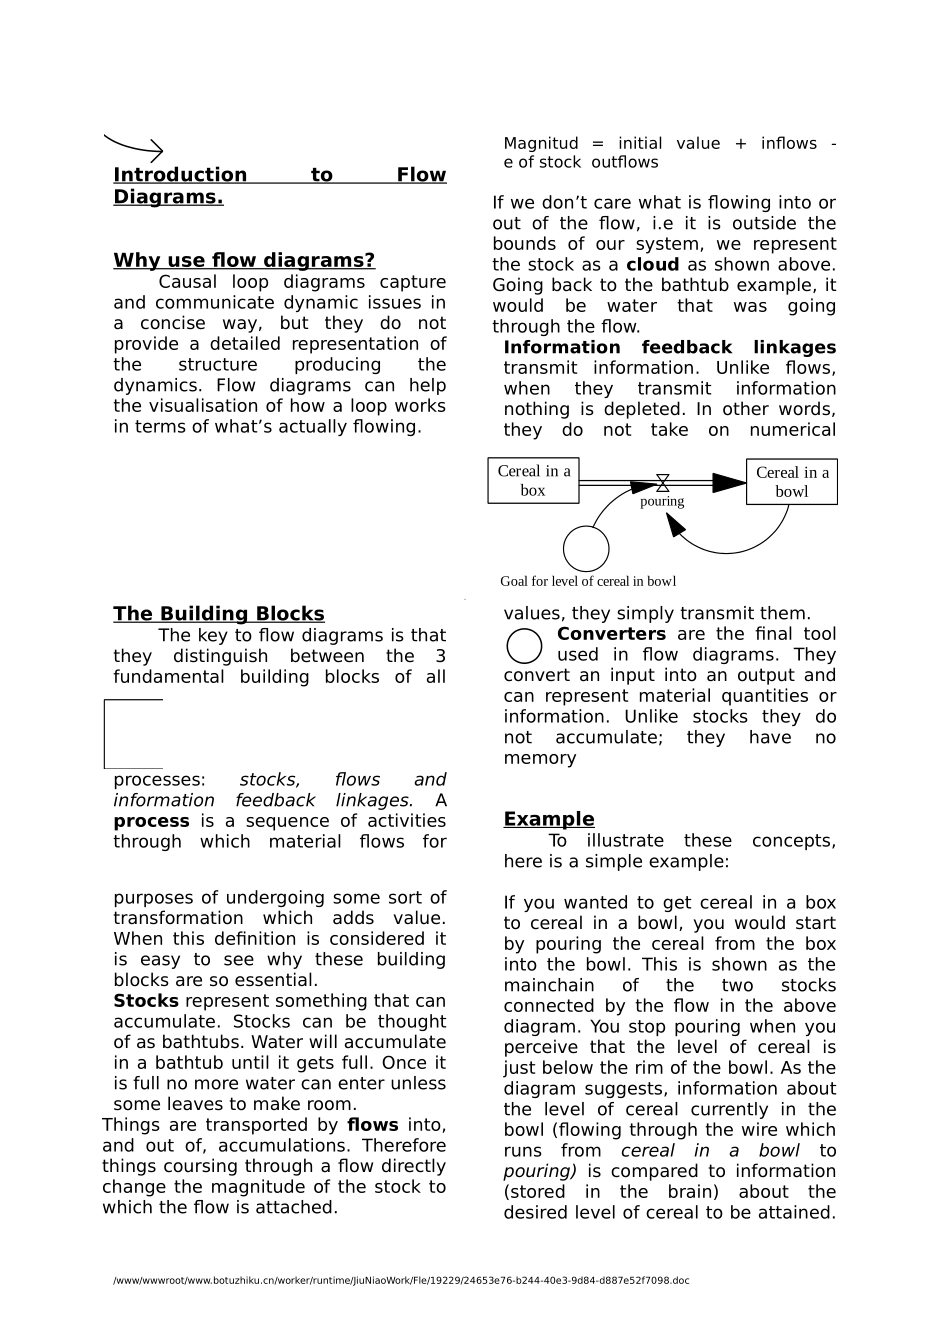
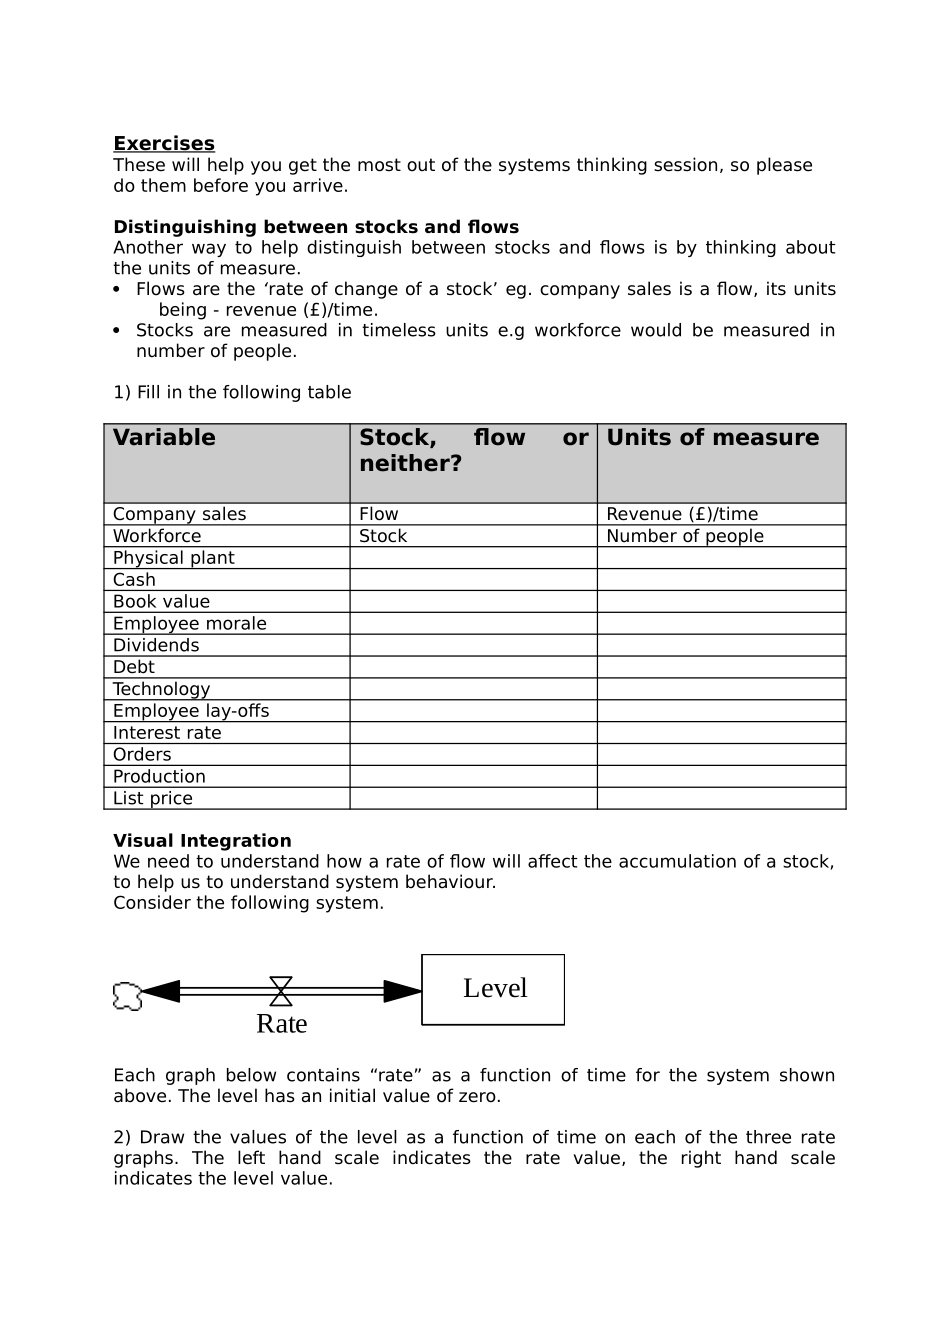
IntroductiontoFlowDiagrams.Whyuseflowdiagrams?Causalloopdiagramscaptureandcommunicatedynamicissuesinaconciseway,buttheydonotprovideadetailedrepresentationofthestructureproducingthedynamics.Flowdiagramscanhelpthevisualisationofhowaloopworksintermsofwhat’sactuallyflowing.TheBuildingBlocksThekeytoflowdiagramsisthattheydistinguishbetweenthe3fundamentalbuildingblocksofallprocesses:stocks,flowsandinformationfeedbacklinkages.Aprocessisasequenceofactivitiesthroughwhichmaterialflowsforpurposesofundergoingsomesortoftransformationwhichaddsvalue.Whenthisdefinitionisconsidereditiseasytoseewhythesebuildingblocksaresoessential.Stocksrepresentsomethingthatcanaccumulate.Stockscanbethoughtofasbathtubs.Waterwillaccumulateinabathtubuntilitgetsfull.Onceitisfullnomorewatercanenterunlesssomeleavestomakeroom.Thingsaretransportedbyflowsinto,andoutof,accumulations.Thereforethingscoursingthroughaflowdirectlychangethemagnitudeofthestocktowhichtheflowisattached.Magnitudeofstock=initialvalue+inflows-outflowsIfwedon’tcarewhatisflowingintooroutoftheflow,i.eitisoutsidetheboundsofoursystem,werepresentthestockasacloudasshownabove.Goingbacktothebathtubexample,itwouldbewaterthatwasgoingthroughtheflow.Informationfeedbacklinkagestransmitinformation.Unlikeflows,whentheytransmitinformationnothingisdepleted.Inotherwords,theydonottakeonnumericalvalues,theysimplytransmitthem.Convertersarethefinaltoolusedinflowdiagrams.Theyconvertaninputintoanoutputandcanrepresentmaterialquantitiesorinformation.Unlikestockstheydonotaccumulate;theyhavenomemoryExampleToillustratetheseconcepts,hereisasimpleexample:Ifyouwantedtogetcerealinaboxtocerealinabowl,youwouldstartbypouringthecerealfromtheboxintothebowl.Thisisshownasthemainchainofthetwostocksconnectedbytheflowintheabovediagram.Youstoppouringwhenyouperceivethatthelevelofcerealisjustbelowtherimofthebowl.Asthediagramsuggests,informationaboutthelevelofcerealcurrentlyinthebowl(flowingthroughthewirewhichrunsfromcerealinabowltopouring)iscomparedtoinformation(storedinthebrain)aboutthedesiredlevelofcerealtobeattained./www/wwwroot/www.botuzhiku.cn/worker/runtime/JiuNiaoWork/Fle/19229/24653e76-b244-40e3-9d84-d887e52f7098.docpouringGoalforlevelofcerealinbowlwCerealinabowlCerealinaboxWhentheamountofcerealinthebowlreachesthetargetlevel,thepouring“decisionrule”(whichtakesasitsinputstheinformationbeingtransmittedviathetwofeedbacklinkages)shutsoffthepouringactivity.Thissimpleprocessshowstheuseofthefourbasiccomponentswhichmakeupeventhemostcomplexbusinessprocesses./www/wwwroot/www.botuzhiku.cn/worker/runtime/JiuNiaoWork/Fle/19229/24653e76-b244-40e3-9d84-d887e52f7098.docExercisesThesewillhelpyougetthemostoutofthesystemsthinkingsession,sopleasedothembeforeyouarrive.DistinguishingbetweenstocksandflowsAnotherwaytohelpdistinguishbetweenstocksandflowsisbythinkingabouttheunitsofmeasure.·Flowsarethe‘rateofchangeofastock’eg.companysalesisaflow,itsunitsbeing-revenue(£)/time.·Stocksaremeasuredintimelessunitse.gworkforcewouldbemeasuredinnumberofpeople.1)FillinthefollowingtableVariableStock,floworneither?UnitsofmeasureCompanysalesFlowRevenue(£)/timeWorkforceStockNumberofpeoplePhysicalplantCashBookvalueEmployeemoraleDividendsDebtTechnologyEmployeelay-offsInterestrateOrdersProductionListpriceVisualIntegrationWeneedtounderstandhowarateofflowwillaffecttheaccumulationofastock,tohelpustounderstandsystembehaviour.Considerthefollowingsystem.RateLevelEachgraphbelowcontains“rate”asafunctionoftimeforthesystemshownabove.Thelevelhasaninitialvalueofzero.2)Drawthevaluesofthelevelasafunctionoftimeoneachofthethreerategraphs.Thelefthandscaleindicatestheratevalue,therighthandscaleindicatesthelevelvalue.-solutionsontheday!01234512345Rate(units/time)TimeLevel(units)123450-1001048121620Rate(units/time)TimeLevel(units)-4004080-800-10010816243240Rate(units/time)TimeLevel(units)80400-40-80