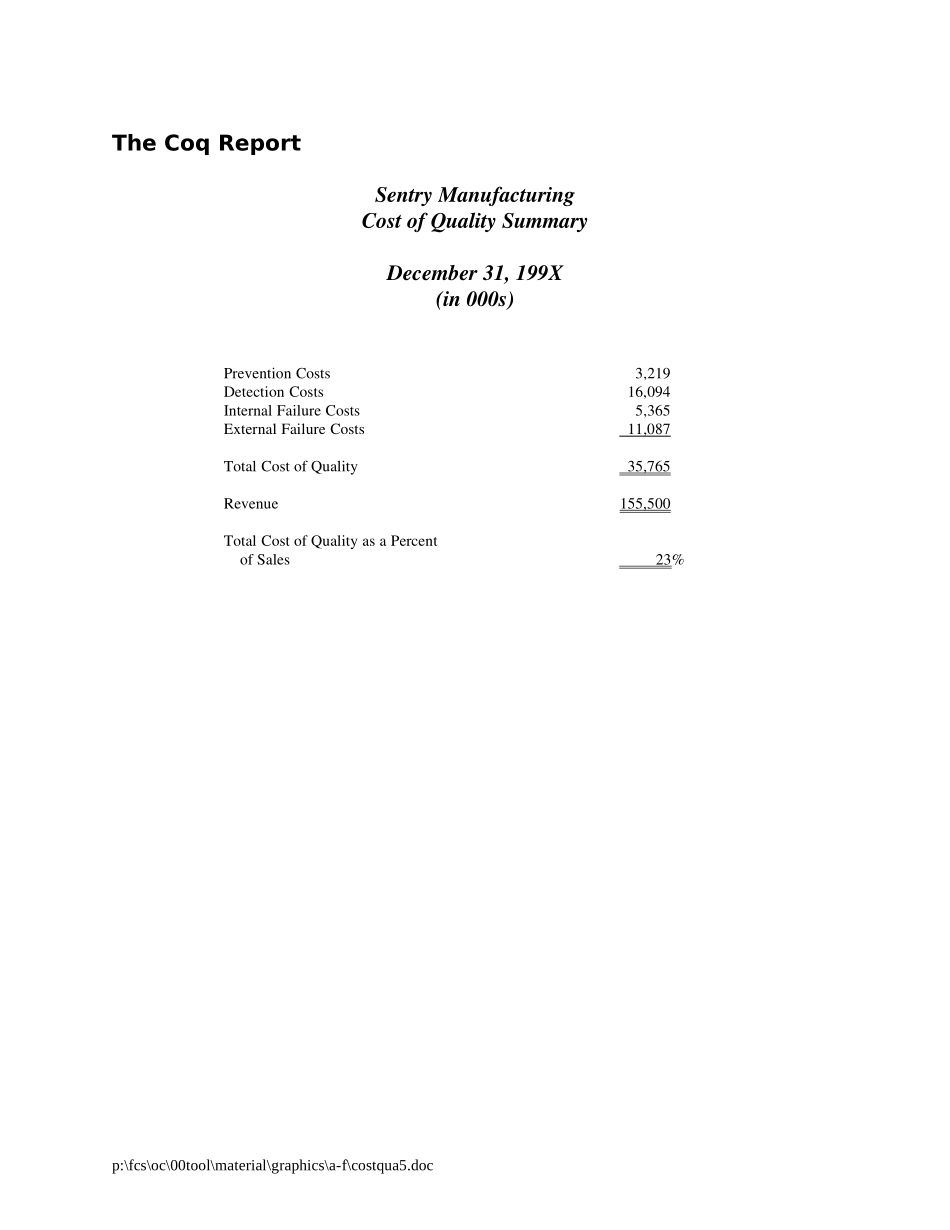
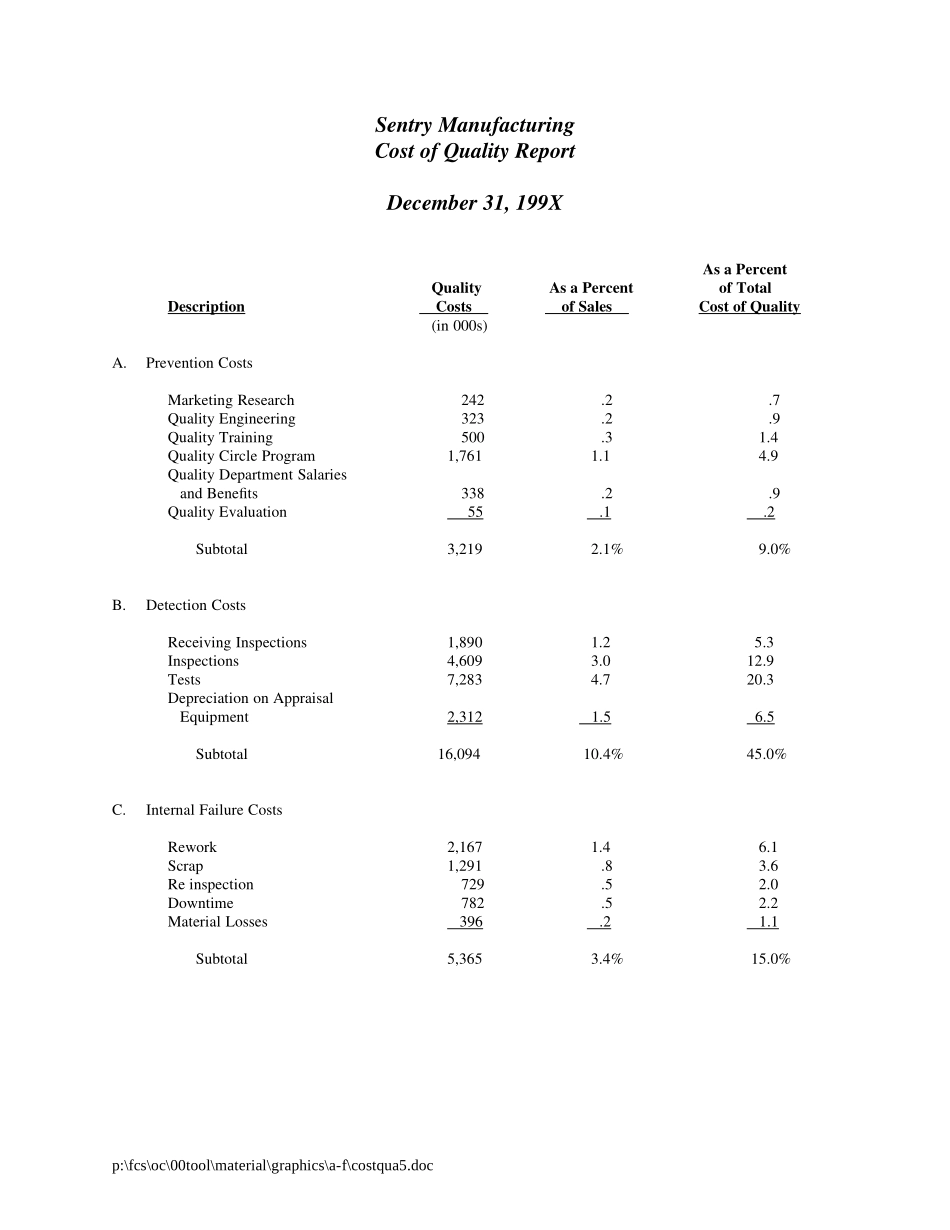
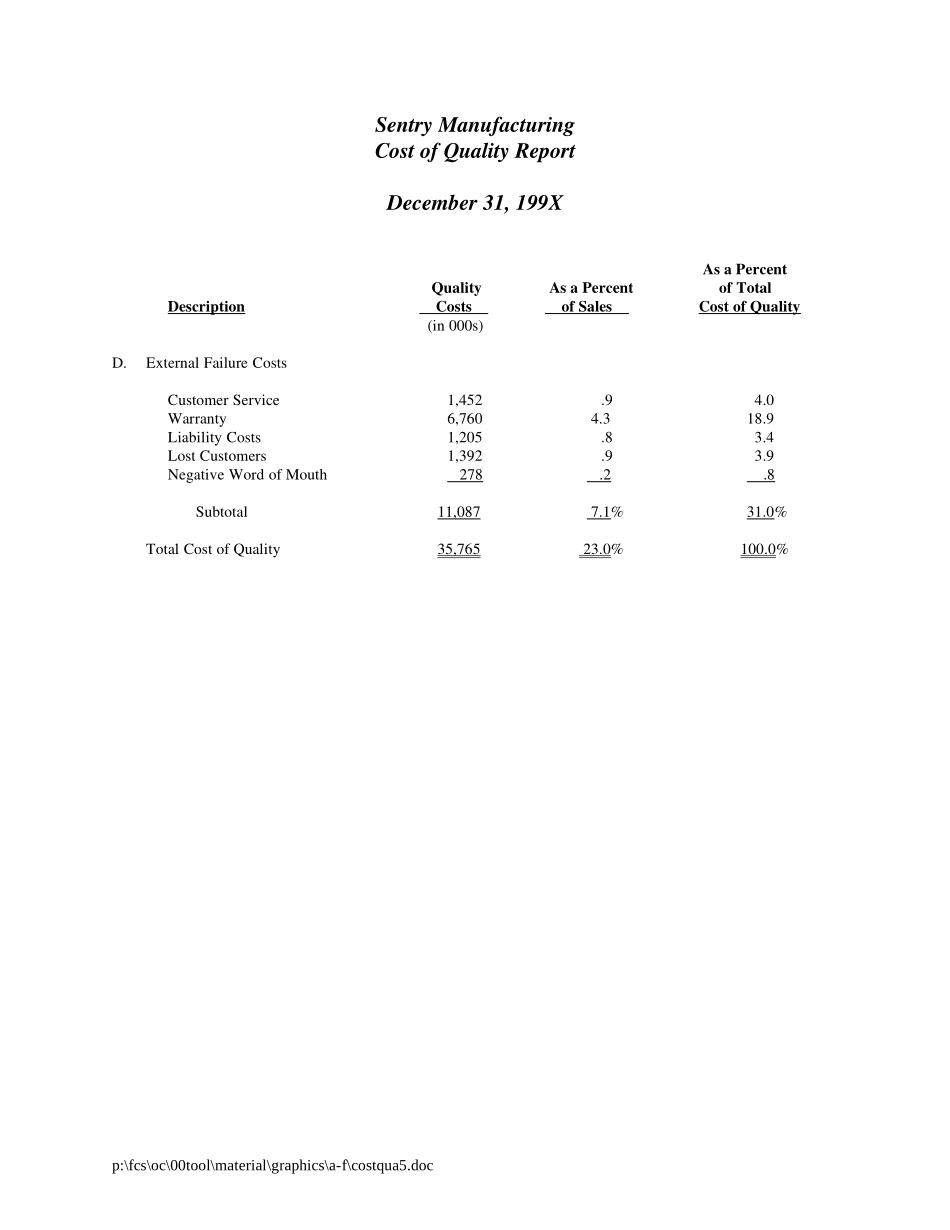
TheCoqReportSentryManufacturingCostofQualitySummaryDecember31,199X(in000s)PreventionCosts3,219DetectionCosts16,094InternalFailureCosts5,365ExternalFailureCosts11,087TotalCostofQuality35,765Revenue155,500TotalCostofQualityasaPercentofSales23%p:\fcs\oc\00tool\material\graphics\a-f\costqua5.docSentryManufacturingCostofQualityReportDecember31,199XAsaPercentQualityAsaPercentofTotalDescriptionCostsofSalesCostofQuality(in000s)A.PreventionCostsMarketingResearch242.2.7QualityEngineering323.2.9QualityTraining500.31.4QualityCircleProgram1,7611.14.9QualityDepartmentSalariesandBenefits338.2.9QualityEvaluation55.1.2Subtotal3,2192.1%9.0%B.DetectionCostsReceivingInspections1,8901.25.3Inspections4,6093.012.9Tests7,2834.720.3DepreciationonAppraisalEquipment2,3121.56.5Subtotal16,09410.4%45.0%C.InternalFailureCostsRework2,1671.46.1Scrap1,291.83.6Reinspection729.52.0Downtime782.52.2MaterialLosses396.21.1Subtotal5,3653.4%15.0%p:\fcs\oc\00tool\material\graphics\a-f\costqua5.docSentryManufacturingCostofQualityReportDecember31,199XAsaPercentQualityAsaPercentofTotalDescriptionCostsofSalesCostofQuality(in000s)D.ExternalFailureCostsCustomerService1,452.94.0Warranty6,7604.318.9LiabilityCosts1,205.83.4LostCustomers1,392.93.9NegativeWordofMouth278.2.8Subtotal11,0877.1%31.0%TotalCostofQuality35,76523.0%100.0%p:\fcs\oc\00tool\material\graphics\a-f\costqua5.docSentryManufacturingCostofQualityWorksheetDecember31,199XA.PreventionCosts1.MarketingResearchDept.2700-Acct.78550241,6862.QualityEngineeringa.EngineeringDept.PreventionProjectsDept.2302-Acct.62200$150,000FringeBenefitsandTaxes(35%)52,500$202,500Dept.2302TotalHours7,360HourlyRate$27.51PreventionProjectHours4,200115,542b.EngineeringDept.ReliabilityEngineeringDept.2302-Acct.62200HourlyRate$27.51ReliabilityProjectHours2,16059,422c.EngineeringDept.PlanningDept.2302-Acct.62200$110,000FringeBenefitsandTaxes(35%)38,500148,500323,4643.QualityTrainingTrainingExpense,Acct.63400$10,400,000TotalTrainingHours416,000TotalCostperTrainingHour$25.00TotalQualityTrainingHours20,000500,000p:\fcs\oc\00tool\material\graphics\a-f\costqua5.doc4.QualityCircleProgramTotalProductionEmployeesInvolvedinQualityCircles2,800NumberofMeetingsperYear(assume1hourmeetingperweek)50AverageLoadedHourlyRate$12.581,761,2005.QualityDepartmentSalariesandBenefits-Dept.2800Salaries$250,000PayrollTaxes27,500FringeBenefits60,000337,5006.QualityEvaluationAA&Co.Invoice(Acct.75520)$55,000TotalPreventionCosts$3,218,850p:\fcs\oc\00tool\material\graphics\a-f\costqua5.docB.DetectionCosts1.ReceivingInspectionDept.3100Acct.513001,890,2612.Inspectionsa.Dept.3200Acct.513203,240,120LessWorkCenter1102LaborCodes11,65,66,and70611,3862,628,734b.Dept.3202Acct.513223,569,020LessCalculationExpenses782,111Salaries242,645HourlyWages564,2001,980,0644,608,7983.Testsa.DirectLaborNumberTotalDepartmentofTestersEmployees330072203302315033041667033064180301220TesterFactor(30/1220).024590DirectDirectLabor&DirectLaborDepartmentLaborHoursOverheadRateExpense3300443,30013.756,095,3753302301,95013.053,940,44833041,353,40012.9517,526,5303306363,60012.304,4,472,28032,034,633787,737p:\fcs\oc\00tool\material\graphics\a-f\costqua5.docb.MaterialDepartmentAccountAmount330053100$118,971330253110181,032330453120603,200330653130340,0601,243,263c.SystemTestsLaborWorkCenter7601DirectLaborHours$122,900StandardLaborRateofWorkCenter760112.751,5...